
A Bird’s-Eye View of Market Cycles
To truly understand where we are in the current market cycle, we need to take a step back and observe the bigger picture. Markets move in cycles, and history has shown that all cycles correct—some more aggressively than others. While investors may get caught up in short-term movements, the long-term trajectory follows a predictable pattern of expansions and contractions.
The Steepness of the Cycle: A Warning Sign
One of the most overlooked yet crucial aspects of market cycles is their angle of ascent. The steeper the climb, the more pronounced the correction tends to be. A near-vertical rise in stock prices is unsustainable and often results in a sharp pullback. Historically, the sharper the incline, the deeper the fall.
We have witnessed this pattern time and time again. When markets enter an extended euphoric phase, corrections become inevitable. This is not speculation—it’s market physics. What goes up too quickly will come down just as fast.
The Current Market Cycle: Where Are We Now?
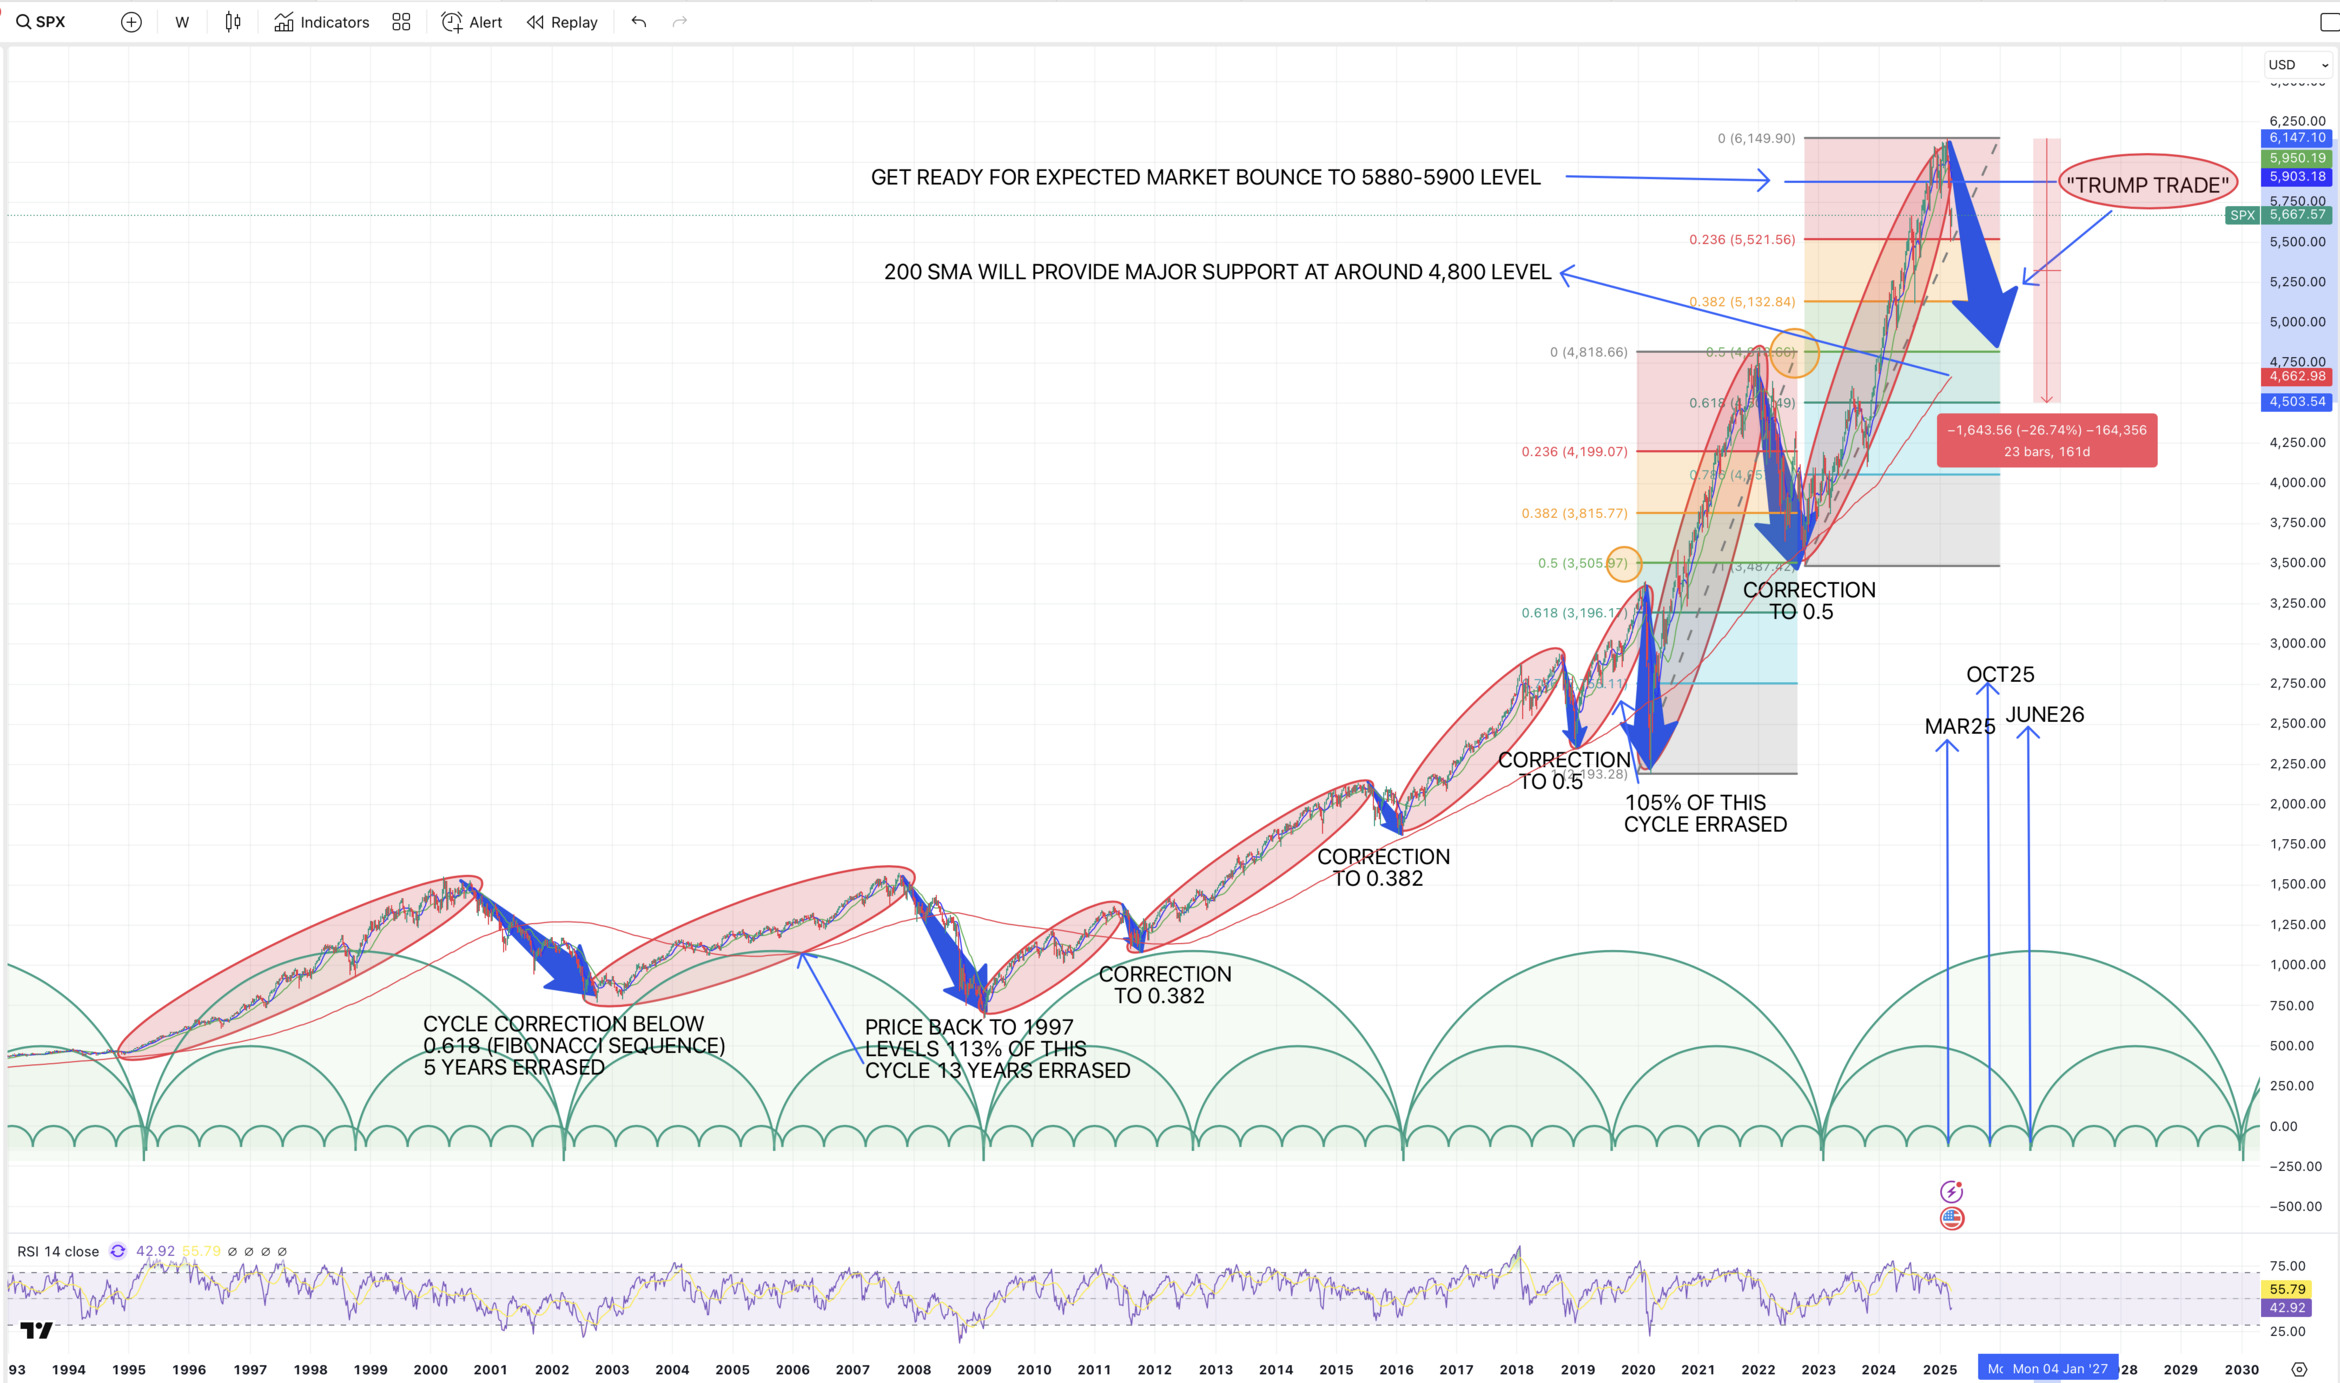
Looking at the current cycle from a technical analysis perspective, regardless of external factors like politics and economic reports, we can see that the market is overdue for a significant correction. Based on Fibonacci retracement levels, corrections typically retrace to at least the 0.5 level—and in extreme cases, as deep as 0.618 or even 0.786.
A retracement to the 0.5 Fibonacci level would bring the market down to approximately 4,500, erasing gains from the last two years. A deeper correction to 0.618 would push it even lower, and a potential extreme drop to 0.786 would be in line with past historical retracements.
What is the Fibonacci Sequence?
The Fibonacci sequence is a mathematical pattern in which each number is the sum of the two preceding ones (e.g., 0, 1, 1, 2, 3, 5, 8, 13, etc.). In financial markets, Fibonacci retracement levels (0.236, 0.382, 0.5, 0.618, 0.786) are used to identify potential areas of support and resistance. These levels help traders anticipate where corrections might pause before the trend resumes.
Fibonacci in Nature and Markets
The Fibonacci sequence is not just a mathematical curiosity—it is found everywhere in nature. From the spiral patterns of galaxies to the arrangement of leaves, flowers, and even the proportions of the human body, Fibonacci numbers are deeply embedded in the world around us. This natural order also extends to financial markets, where human psychology and collective behavior create repeating price patterns. Because traders and institutions recognize these Fibonacci levels, they often act as self-fulfilling support and resistance zones in stock charts.
Why This Correction is Different
The recent rally has been characterized by record-breaking speed and sharp inclines, making it even more susceptible to a severe pullback. Investors must recognize that the market does not move in a straight line—corrections are a natural and necessary part of the cycle.
Those who ignore history risk being caught off guard, but those who study market patterns understand that opportunity lies in positioning for the inevitable correction and the subsequent rebound.
The “Trump Trade” and How to Capitalize on the Fall
With the U.S. elections behind us, many investors are drawing parallels to past political cycles, particularly the Trump-era market rally and corrections. While politics may influence short-term sentiment, the broader market structure is dictated by technical levels and historical patterns.
Here’s how savvy investors can approach this:
- Recognize the overextension – The market’s steep climb suggests a coming correction.
- Prepare for a pullback – Expect a correction to at least 0.5 Fibonacci, possibly deeper.
- Strategically position – Moving to cash or hedging at market peaks can provide capital to reinvest at lower levels.
- Look for historical support levels – 5,132 is the first key level, followed by 4,816 and lower at 4505 level, if the correction deepens.
- Be ready to buy the recovery – Once the correction plays out, history suggests a strong rally follows.
Scenario Analysis: Impact on a $200K Portfolio
To illustrate the significance of understanding market cycles, let’s analyze two potential scenarios for an investor with a $200,000 portfolio:
Scenario 1: No Market Cycle Awareness
The investor remains fully invested as the market corrects.
- At the 0.382 Fibonacci level, their portfolio could drop to $176,400.
- If the correction reaches the 0.5 Fibonacci level, their portfolio could drop to $150,000.
- A deeper correction to 0.618 could reduce their holdings to $138,000.
- A full retracement to 0.786 might bring it down to $125,000.
The investor experiences significant losses and must wait years for recovery.
Scenario 2: Strategic Positioning Based on Market Cycles
The investor recognizes the overextension and reduces exposure near market highs, moving 100% of the portfolio ($200,000) to cash at peak levels to preserve capital.
As the market corrects, the investor gradually reinvests at lower prices:
- At 0.382 Fibonacci: Invests 10% ($20,000)
- At 0.5 Fibonacci: Invests 50% ($100,000)
- At 0.618 Fibonacci: Invests 25% ($50,000)
- At 0.786 Fibonacci: Invests 15% ($30,000)
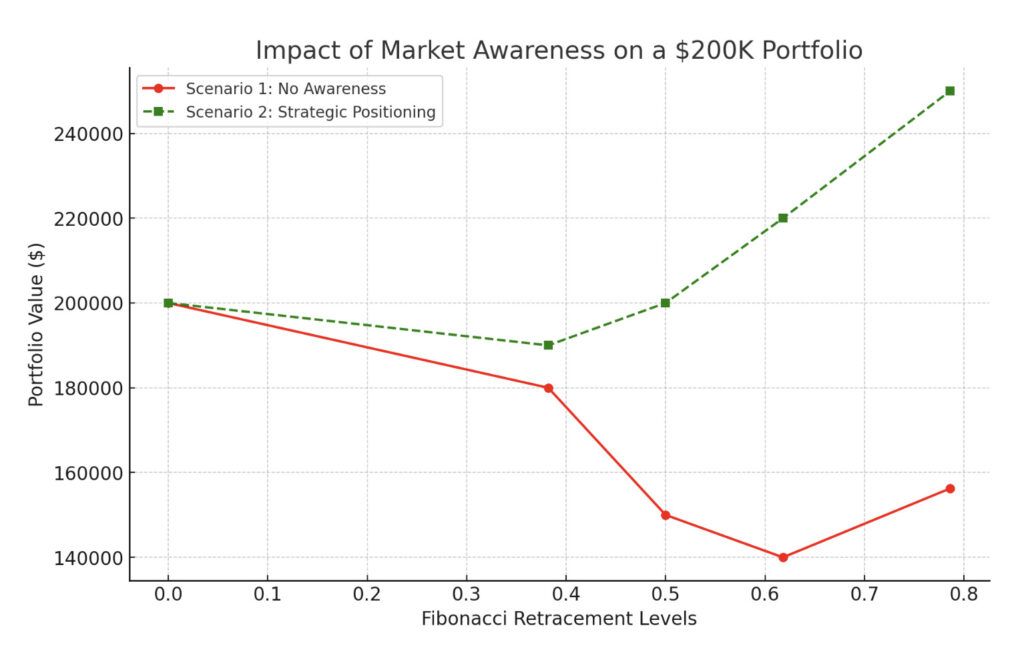
Instead of suffering major losses, the investor buys stocks at lower prices, positioning for a rebound. When the market recovers, their portfolio has the potential to grow substantially faster, potentially outperforming those who held through the downturn.
Comparison
| Metric | Scenario 1 | Scenario 2 | Difference |
|---|---|---|---|
| Final Portfolio Value | $156,250 | $250,000 | +$93,750 |
| Percentage Advantage | — | — | +60% |
The “Trump Trade” Effect: Why Sitting Still Can Cost You Big
In portfolio management, the difference between a passive investing approach and a strategic, actively managed approach can be staggering. This analysis doesn’t factor in advanced trading techniques, shorting opportunities, or hedging strategies—it simply illustrates what happens when you do nothing during a major market correction versus patiently holding cash and re-entering at the right moment.
As shown in the graph, an investor who passively holds assets without market awareness sees their portfolio value plummet to $120,000 after a correction to the 0.786 Fibonacci retracement level. Meanwhile, a strategically positioned investor who waits in cash before redeploying capital sees their portfolio rise to $240,000—a 60% difference. This stark contrast underscores why blindly holding through downturns can be costly, and how market awareness and timing can significantly impact long-term financial success.
Final Thoughts
The stock market is not random. It moves in cycles, and those who study these cycles can anticipate and capitalize on them. The current setup suggests a substantial correction ahead—one that could erase years of gains before the next leg higher.
Timing the market is always a challenge, but one thing seems clear: the risk-to-reward ratio over the next 1-2 years appears heavily skewed to the downside. Looking at the charts, the summer months leading into October 2025 and the period from March 2026 through the summer of 2026 stand out as particularly high-risk windows for the markets.
Are you ready for the “Trump Trade” correction?
I recently shared a key insight on X about the impact of corrective phases and how they unfold in past corrections. 📉🔄 Recognizing these market cycles can help you navigate uncertainty with confidence.
Check out my post here: X Post
For a deeper dive into the Trump Trade strategy and how to capitalize on these cycles, read the full breakdown:
👉 Trump Trade: Understanding Market Cycles and Capitalizing on the Fall
Investing involves risks, including potential loss of principal. Past performance does not guarantee future results. This information is for educational purposes only and should not be considered financial advice. Consult a qualified financial professional before making investment decisions.