
Understanding Bitcoin’s Market Cycles
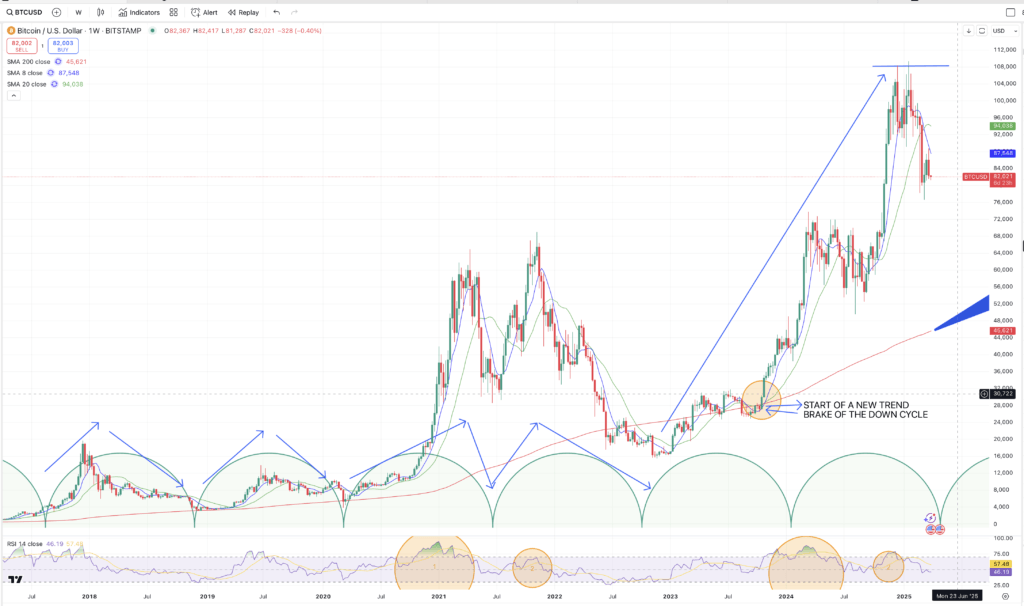
Bitcoin operates in well-defined market cycles, typically driven by the halving events that occur approximately every four years. These cycles exhibit periods of exponential growth followed by substantial corrections. By analyzing past cycles, traders and investors can make informed projections about potential price movements in the future.
Cycle #1: March 2020 – November 2022
The first cycle in this analysis ran from March 2020 to November 2022, lasting approximately 58 weeks. During this period, BTC experienced a meteoric rise, reaching its cycle high near $69,000 before undergoing a 77% correction, which brought it down to the 0.786 Fibonacci retracement level. This deep correction was in line with historical BTC market patterns, where previous cycles also saw retracements of 75%-85% from their peaks.
Key observations from Cycle #1:
- BTC followed a predictable bull run pattern post-March 2020.
- The cycle high occurred in November 2021, aligning with Bitcoin’s halving-driven cycles.
- The correction phase was deep, hitting significant Fibonacci levels before finding support around $17,000-$18,000.
Cycle #2: November 2022 – August 2026 (Projected)
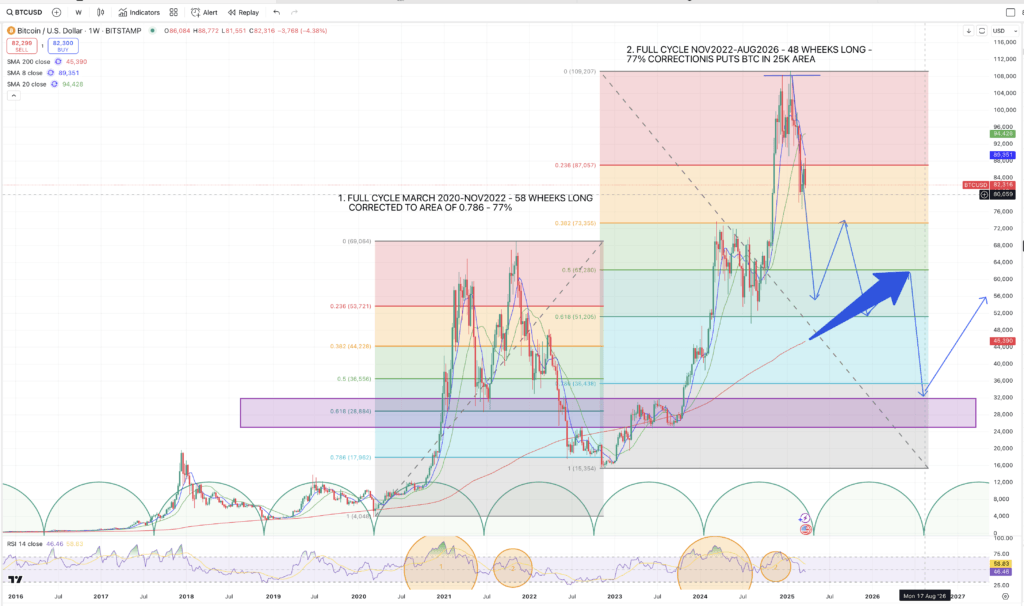
The ongoing BTC market cycle began in November 2022, with Bitcoin climbing past its previous highs and reaching above $100,000 in early 2024. However, based on past trends, significant corrections are inevitable before the next sustained bull run. If history repeats itself, BTC may undergo another 77% correction, which would place its price in the $25,000 range.
Projected Price Movements in Cycle #2
- Current peak: Bitcoin has topped around $100,000-$110,000 in this cycle.
- Correction phase: A worst-case scenario would see BTC revisiting the $25,000-$30,000 range, similar to prior cycle retracements.
- Long-term recovery: After this correction, BTC is expected to regain momentum heading into the next halving event in 2028.
The $51K Barrier: Bitcoin’s Make-or-Break Resistance Zone
A crucial resistance zone for BTC is the $51,000 level, which coincides with the 0.618 Fibonacci retracement of the current cycle and aligns with the rising 200-week moving average (200MA). Historically, Bitcoin has struggled to break above this level in bear market recoveries, making it a significant test for the asset.
If BTC fails to sustain momentum above this price, it could indicate a deeper correction phase before any potential recovery. Traders should closely monitor this area for strong rejection signals, as a failure to break through could accelerate downside momentum towards lower support zones.
Worst-Case Scenario: BTC at $25K by August 2026
If BTC follows historical correction patterns, a worst-case scenario would involve:
- A deep decline of ~77% from its peak, aligning with past market cycles.
- A slow recovery phase post-2026, where BTC consolidates before beginning another growth phase leading into the next halving.
- Increased volatility, with BTC experiencing multiple bear market rallies before stabilizing at its cycle low.
Critical Price Levels: Bitcoin’s Make-or-Break Zones
Despite Bitcoin’s sharp correction from its peak, it remains in a long-term uptrend and has the potential to salvage its momentum by closing above the $96K level. A sustained weekly close above this price point would indicate that BTC is still holding its upward trajectory, setting the stage for a renewed bullish push.
On the other hand, if Bitcoin fails to hold $76.6K, it would signal that its upward force has broken, allowing gravity to take over and potentially pulling BTC down towards its 200-week moving average (200MA). These critical price points will determine whether Bitcoin can maintain its bullish structure or if a deeper correction is on the horizon.
If BTC follows historical correction patterns, a worst-case scenario would involve:
If BTC follows historical correction patterns, a worst-case scenario would involve:
- A deep decline of ~77% from its peak, aligning with past market cycles.
- A slow recovery phase post-2026, where BTC consolidates before beginning another growth phase leading into the next halving.
- Increased volatility, with BTC experiencing multiple bear market rallies before stabilizing at its cycle low.
Final Thoughts
Certain chart patterns have a tendency to play out in specific ways, and Bitcoin has repeatedly shown that parabolic price increases over a short period of time often correct just as fast, if not faster, erasing all prior gains. While we are exploring these possibilities strictly from a technical chart perspective, we must acknowledge that predicting the exact extent of a move is nearly impossible.
For Bitcoin, the $50K level appears to be a formidable support zone, making a drop below it seem unlikely. However, as a chartist, I wouldn’t be shocked to see BTC at $25K if a deep correction were to occur. Given that Bitcoin has been trading more and more in correlation with the stock market, this raises a critical question: If Bitcoin were to fall to $25K, what would the stock market look like? A severe BTC downturn could signal broader financial instability.
Let’s hope this scenario never plays out—but as traders, we must always prepare for all possibilities. Stay informed, manage risks, and be ready for Bitcoin’s next major move.
Disclaimer
This analysis is for informational purposes only and does not constitute financial advice. Cryptocurrency markets are highly volatile and unpredictable. Always conduct your own research and consult with a professional before making any investment decisions.